Putin 2024 Meduza breaks down the evidence pointing to the most fraudulent elections in modern Russian history
On March 18, Russia’s Central Election Commission (CEC) announced that Vladimir Putin would remain in power for a fifth presidential term, following a landslide “election” win. According to the CEC’s preliminary data, Putin received a record-breaking 87.28 percent of the vote with an equally record-breaking voter turnout of 77.44 percent. Surprisingly, the CEC continues to publish data on individual polling stations, making it possible to piece together how the authorities manufactured these unprecedented results. Peculiarities in the vote count itself paint a clear picture of what appears to be the most fraudulent election in Russia’s modern history. Meduza examines the evidence.
All current analyses of Russia’s voting results, both here and in other publications, are based on data from the Russian Central Election Commission’s (CEC) website that were collected and made publicly available by programmer and electoral analyst Ivan Shukshin. The data cover 98 percent of polling stations, including those from Russian-annexed Crimea but excluding those from other occupied areas of Ukraine. Ivan Shukshin’s own analysis of the election results can be found here.
What’s the evidence?
Some of the statistical anomalies in the data show clear evidence of falsifications since they can’t be explained by anything else. Others appear highly suspicious but could theoretically have other causes. In other words, anomalies come in different forms and should be examined individually.
The two main anomalies prevalent in almost all recent Russian elections are a correlation between the ruling party candidate’s results and the turnout, and spikes at round values for both voter turnout and election results. This time, the magnitude of both anomalies has reached unprecedented levels.
Your help can be the bridge to hope for many in Russia. Join Meduza in its mission to challenge censorship with the truth. Donate today.
More ‘turnout,’ more Putin
Leading independent election analyst Sergey Shpilkin has been studying the distribution of votes and voter turnout in Russian elections since the early 2010s and has come up with a method for distinguishing between legitimate votes and falsified ballots. According to Shpilkin’s logic, since the exact number of voters who come to a given polling station and the number of votes they cast for different candidates hinge on numerous random factors, the overall spread of voter turnout and candidate results across polling stations should be characteristic of random processes and fall along a normal, bell-shaped curve. On a scatter plot of these two variables, the polling stations should appear as a single, symmetrical spot. Any deviations from this distribution would be considered anomalous and require a separate explanation. These kinds of deviations have been observed in Russian elections since at least 2004.
The most obvious explanations are either physical ballot stuffing or falsified voting records. This type of fraud simultaneously increases voter turnout numbers and the final percentage of votes for the ruling party’s candidate. Polling stations engaged in this fraud fall to the right of a normal distribution: on a scatter plot showing the relationship between voter turnout and votes for the state’s candidate, they appear as a tail extending to the upper right corner.
This is what such a scatter plot from the 2018 Russian presidential elections looks like:
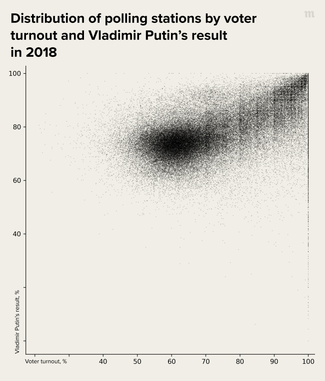
Already, the tail is large enough to have a significant effect on the overall results, even just based on the sheer number of polling stations with anomalous figures.
Here’s what the same distribution looks like for the 2024 “elections”:
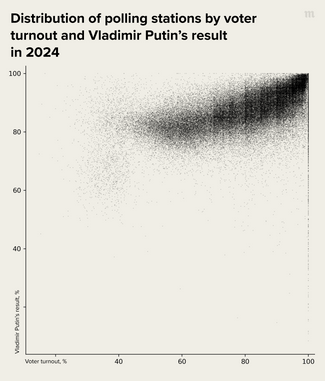
The central core of typical polling stations has vanished in the latest election: other than a very faint spot at around 40 percent voter turnout, only anomalous polling stations are left. Looking at the regional breakdown, this barely visible cluster is almost entirely made up of Moscow polling stations. However, even this breaks down further into two discrete clusters with centers at around 65 percent and 85 percent. This could be explained away if there were essentially “two Moscows” with fundamentally different levels of support for Putin, but no such picture emerged in any previous election. Another explanation is the influence of mass remote electronic voting on individual polling stations, which raises the percentage of votes for Putin. The same pattern could show up if votes from one candidate were reallocated to another without ballot stuffing (or the corresponding change in “turnout” numbers).
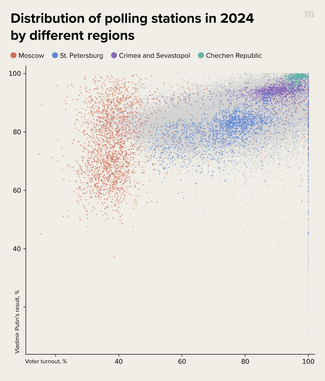
In St. Petersburg, the picture is fundamentally different. Here, there aren’t any clusters of polling stations with average turnout: there’s basically just the tail (as well as unnatural jumps in results between regions, a clear indicator that the results were fabricated). Annexed Crimea and Sevastopol show a similar, but even more pronounced picture.
The anomalous vote distribution, which has lost any resemblance to a bell curve, could perhaps be explained away by the heterogeneity of Russian regions. Both support for the government and voter turnout could differ widely due to a variety of local factors. If this were the case, the distribution wouldn’t show up as a bell curve, even without electoral fraud.
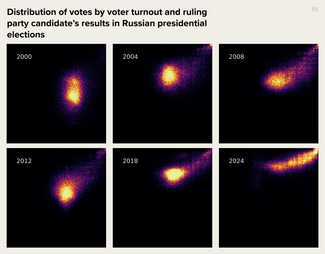
This might make for a strong objection if it weren’t for one thing: Russia has been holding elections for years, but only now, in 2024, has the normal distribution pattern completely disappeared. The graph below shows the distribution of votes for all presidential elections in Russia starting from 2000. One can clearly see that what used to be a deviation has become the norm, and the norm has completely disappeared.
Convenient counting
The second most significant anomaly in both these and previous elections is something often referred to as “Churov’s saw”: peaks at round values for both voter turnout and results. Unlike the correlation between the result and turnout, the causes of which can be debated, this anomaly can’t be explained by anything other than manipulating the numbers to achieve the desired outcome.
While there’s some small background amount where peaks can occur in distributions for purely mathematical reasons (for example, due to the finite number of registered voters at a given polling station), this is easy to account for using statistical methods.
In the past, researchers Dmitry Kobak, Sergey Shpilkin, and Maxim Pshenichnikov have statistically verified the presence of peaks at round values that, generally speaking, are visible even to the naked eye. These peaks first appeared in Russia’s 2004 elections and have only become more pronounced since.
To quantify how much worse the situation’s become, we analyzed the 2024 data collected by Ivan Shukshin using the same methods. The graphs below show the distribution of polling stations by turnout and by Putin’s percentage of the vote for both 2024 and the previous presidential election, in 2018.
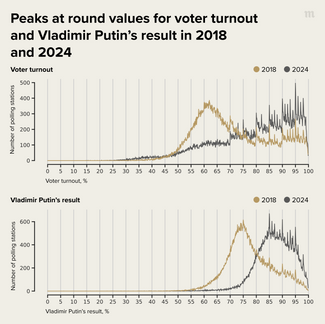
It’s clear that the situation with record manipulation hasn’t simply worsened but fundamentally changed: there’s no longer a dominant majority of polling stations with normal turnout and a minority with visibly falsified data. Now, the latter constitute the majority, and it’s impossible to isolate any normal average turnout from the distribution. In other words, the distribution has completely lost any semblance of normality.
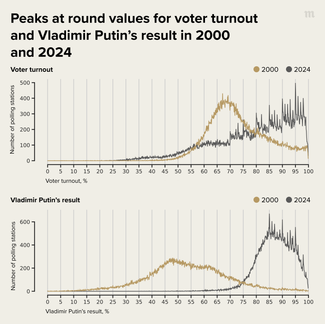
When comparing the 2018 and 2024 presidential elections, it’s important to remember that the level of fraud in 2018 was already so extensive that the results should have been invalidated, even according to Russian laws. In light of this, it’s useful to compare the current situation to when Vladimir Putin was first elected president in 2000 (the last Russian presidential elections without peaks of manipulated numbers). Here, it’s clear that arguments suggesting Russia is too unique of a country to fit expected voter turnout patterns don’t hold up to criticism. The country in the two graphs hasn’t changed — the guidelines for vote counting have.
Even when compared to 2018, the level of record manipulation in 2024 is staggering. In an article on the 2018 Russian presidential election, Kobak, Shpilkin, and Pshenichnikov published a graph showing how the number of polling stations with manipulated records grew over time. When adding in new data from 2024, it appears that the number of polling stations manipulating records has almost doubled since 2018.
Where’s the truth?
Using Sergey Shpilkin’s methodology, Ivan Shukshin estimated that electoral commissions gave Vladimir Putin around 22 million extra votes, mainly through voting record manipulation rather than physical ballot stuffing or “carousel voting.” But Shukshin’s approach requires a core of normal data from which deviations can be extrapolated, and in the 2024 Russian presidential elections, there was no identifiable norm. Indeed, using the same data, Novaya Gazeta Europe calculated a surplus of 31.6 million votes for Putin. This discrepancy can be explained by the fact that Shukshin and Novaya Gazeta Europe drew on different vote clusters to represent what they used in their calculations as “normal.”
In reality, neither estimate can be said to accurately represent the current situation. As can be seen in the graphs above, there’s no longer a cluster of normal polling stations in Russia from which the true average percentage of votes cast for candidates can be calculated. Shpilkin’s method has its limitations: it only takes into account inflated numbers at polling stations, not other types of fraud, and it only works when anomalies don’t become the majority. With the current level of reliably documented fraud, there’s no normal majority anymore — the method simply has nothing to rely on.
However, even though the exact number of stolen votes remains unknown, Russia’s 2024 presidential election was almost certainly the most fraudulent in the nation’s history. Moreover, the sheer magnitude of fraud eclipses that of 2018, when the extent was already such that the results should have been legally nullified, according to Russia’s own laws.
